Planning Your Perfect UK Road Trip as an EV Owner
![]() 09/08/2024
09/08/2024![]() 8 minutes read
8 minutes read
With the expansion of Clean Air Zones (CAZ) and London’s Ultra Low Emission Zones (ULEZ), electric vehicles (EVs) are becoming an increasingly popular option for road users.
Because of this uptake in EVs, planning a road trip won’t just involve plotting scenic routes and booking accommodations - it’ll include checking the availability of EV charging stations on your route to ensure a smooth journey.
However, disparities exist, with some locations offering abundant charging options compared to a relatively low number of registered electric vehicles in the area, and others falling short where demand is high.
Here at Northgate Vehicle Hire, we delve into the data from Gov.uk to reveal where the most EV-accessible destinations are across the UK to help you plan your road trip, or to help you plot the best route for your electric vehicle.
5 Key Insights from the Data
- Top Regions for EV Charger Density: As expected, London leads the way with Hammersmith and Fulham, Westminster, and the City of London having the highest density of charging devices per 100,000 population, making the capital highly accessible for EV drivers. Outside of London, regions like Birmingham, Bristol, and Coventry also offer substantial charging infrastructure, ensuring EV drivers are well-supported.
- High EV Ownership: Regions like Stockport and Slough have a high number of registered electric vehicles but relatively fewer chargers, indicating potential pressure points where demand for charging infrastructure exceeds supply.
- Charging Hotspots: Cities such as Birmingham and Coventry boast an extensive network of public charging devices, ensuring that EV drivers have reliable access to power during their stay.
- Best Road Trip Destinations: Locations like Brighton & Hove, Edinburgh, and York offer a balance of good charging infrastructure and appealing tourist attractions, making them ideal for EV road trips.
- Disparities in Infrastructure: Some regions, such as the Isles of Scilly, have either very few or no public charging devices, highlighting the need for improved infrastructure to support the growing number of electric vehicles.
Best Cities for EV Chargers
The data from Gov.uk reveals a mixed landscape of charging infrastructure for electric vehicles across the UK.
In London, boroughs such as Hammersmith, Fulham and Westminster boast the highest number of chargers compared to the registered number of electric vehicles in these areas - making the capital incredibly accessible for EV drivers with almost one charger per car.
Outside of London, areas such as Birmingham, Coventry, and Brighton & Hove share similar results, with high numbers of chargers compared to the registered number of EVs - making them very convenient for EV drivers.
These areas have invested significantly in their charging networks, providing numerous options to ensure EV drivers are never caught short.
Locations with an abundance of EV infrastructure compared to no. of EVs:
*”Chargers Per EV” metric extrapolated by division of public charging devices with number of EVs registered for each location.
Data Source: Gov.uk
Worst Cities for EV Chargers
Conversely, regions like the Isles of Scilly and Castle Point have very few chargers relative to their EV ownership.
The Isles of Scilly, in particular, stand out with virtually no public charging infrastructure, posing a significant challenge for EV owners who wish to visit the scenic locale.
Additionally, places like Stockport and Slough have a high number of EVs but relatively fewer chargers, creating potential bottlenecks and highlighting the need for further investment in charging infrastructure.
Locations needing improvement in EV infrastructure:
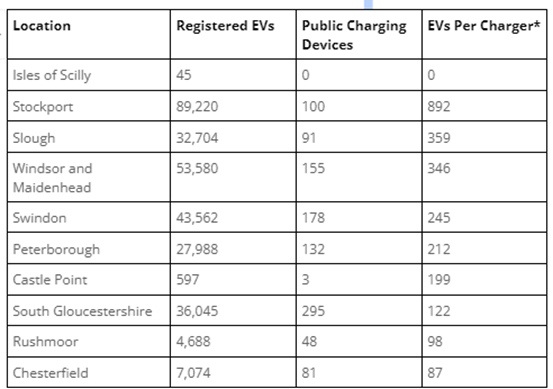
*”EVs Per Charger” metric extrapolated by division of number of registered EVs with public charging devices for each location.
Data Source: Gov.uk
Plan Your EV Summer Road Trip in the UK
Despite these disparities, many destinations remain excellent for EV drivers.
Brighton & Hove, Edinburgh, and York not only offer a wealth of attractions for visitors but also have sufficient charging infrastructure to support electric vehicle tourism.
Cities like Birmingham and Coventry, with their extensive networks of public charging devices, ensure that EV drivers can travel with peace of mind, knowing that they will have access to chargers when needed.
Total data: Highest-to-Lowest Total Public Charging Devices
|
Geography |
Total EVs Registered Q1 2024 |
Total public charging devices |
Total public 50kW and above |
Charging devices per 100,000 population |
|
United Kingdom |
1,096,966 |
64,632 |
12,474 |
96 |
|
Westminster |
21,873 |
2,697 |
72 |
1276 |
|
Hammersmith and Fulham |
5,626 |
2,662 |
58 |
1437 |
|
Coventry |
2,379 |
2,084 |
79 |
586 |
|
Southwark |
3,414 |
1,844 |
24 |
591 |
|
Wandsworth |
3,000 |
1,451 |
37 |
441 |
|
Brent |
4,269 |
1,004 |
16 |
294 |
|
Richmond upon Thames |
3,761 |
1,004 |
20 |
515 |
|
Kensington and Chelsea |
2,673 |
906 |
4 |
620 |
|
Merton |
3,027 |
800 |
17 |
373 |
|
Ealing |
6,792 |
698 |
55 |
189 |
|
North Yorkshire |
7,320 |
689 |
145 |
111 |
|
Waltham Forest |
1,406 |
686 |
23 |
249 |
|
Cornwall |
4,977 |
642 |
159 |
112 |
|
Camden |
3,076 |
640 |
12 |
294 |
|
Milton Keynes |
41,954 |
637 |
171 |
218 |
|
Glasgow City |
4,659 |
637 |
100 |
102 |
|
Hounslow |
3,064 |
598 |
97 |
206 |
|
Hackney |
1,276 |
598 |
23 |
229 |
|
Birmingham |
5,799 |
583 |
188 |
50 |
|
Liverpool |
2,374 |
582 |
42 |
117 |
|
Islington |
1,900 |
569 |
29 |
258 |
|
Leeds |
39,922 |
548 |
114 |
67 |
|
City of Edinburgh |
5,038 |
523 |
91 |
102 |
|
Lambeth |
1,884 |
496 |
22 |
157 |
|
Brighton and Hove |
2,228 |
455 |
20 |
164 |
|
Somerset |
5,323 |
451 |
94 |
78 |
|
Barnet |
6,523 |
450 |
71 |
116 |
|
Shropshire |
2,966 |
431 |
42 |
132 |
|
Manchester |
3,872 |
427 |
84 |
75 |
|
Tower Hamlets |
1,696 |
397 |
28 |
122 |
|
Highland |
1,902 |
393 |
125 |
167 |
|
Watford |
1,043 |
392 |
20 |
381 |
|
Wiltshire |
26,313 |
387 |
126 |
75 |
|
Northumberland |
3,214 |
383 |
43 |
118 |
|
Croydon |
3,463 |
370 |
67 |
94 |
|
Kingston upon Thames |
2,123 |
365 |
19 |
217 |
|
Buckinghamshire |
9,177 |
354 |
66 |
63 |
|
Solihull |
10,945 |
343 |
65 |
158 |
|
Sunderland |
1,726 |
334 |
49 |
120 |
|
County Durham |
3,825 |
313 |
81 |
59 |
|
Dumfries and Galloway |
986 |
307 |
73 |
211 |
|
South Gloucestershire |
36,045 |
295 |
150 |
100 |
|
West Northamptonshire |
4,576 |
295 |
119 |
69 |
|
Reading |
1,305 |
294 |
31 |
168 |
|
South Lanarkshire |
3,222 |
282 |
99 |
86 |
|
Sheffield |
4,754 |
281 |
47 |
50 |
|
Nottingham |
1,903 |
276 |
83 |
84 |
|
North Lanarkshire |
2,772 |
272 |
122 |
80 |
|
East Lothian |
1,388 |
265 |
42 |
236 |
|
Haringey |
2,071 |
264 |
34 |
101 |
|
Newham |
1,559 |
264 |
20 |
74 |
|
West Berkshire |
2,309 |
260 |
101 |
160 |
|
Dorset |
4,012 |
256 |
78 |
67 |
|
Welwyn Hatfield |
1,617 |
256 |
33 |
213 |
|
Cherwell |
3,519 |
253 |
88 |
154 |
|
Stroud |
1,765 |
253 |
70 |
205 |
|
Greenwich |
1,907 |
245 |
59 |
84 |
|
Enfield |
2,693 |
241 |
50 |
74 |
|
North Northamptonshire |
4,811 |
238 |
64 |
66 |
|
Dundee City |
1,422 |
229 |
66 |
154 |
|
Pembrokeshire |
1,015 |
229 |
38 |
184 |
|
Fife |
3,346 |
226 |
45 |
61 |
|
Cambridge |
1,730 |
226 |
48 |
154 |
|
Perth and Kinross |
1,804 |
225 |
78 |
149 |
|
Cheshire West and Chester |
4,071 |
220 |
45 |
61 |
|
Lewisham |
1,642 |
219 |
35 |
73 |
|
Central Bedfordshire |
4,029 |
217 |
57 |
72 |
|
Hillingdon |
10,970 |
215 |
78 |
69 |
|
Swansea |
3,011 |
215 |
60 |
89 |
|
Warrington |
2,504 |
215 |
33 |
102 |
|
Newcastle upon Tyne |
2,085 |
213 |
48 |
69 |
|
West Suffolk |
1,730 |
212 |
55 |
116 |
|
Exeter |
2,195 |
209 |
90 |
155 |
|
Sutton |
2,105 |
209 |
33 |
100 |
|
Bradford |
3,401 |
208 |
82 |
38 |
|
Plymouth |
1,424 |
208 |
37 |
78 |
|
Bournemouth, Christchurch and Poole |
3,574 |
207 |
77 |
52 |
|
Cheshire East |
5,545 |
204 |
59 |
50 |
|
Aberdeenshire |
2,855 |
202 |
44 |
77 |
|
Aberdeen City |
1,905 |
202 |
58 |
90 |
|
Trafford |
2,719 |
201 |
127 |
85 |
|
Gateshead |
1,376 |
200 |
76 |
101 |
|
Medway |
2,383 |
196 |
59 |
69 |
|
Bedford |
2,121 |
196 |
61 |
105 |
|
Stirling |
6,266 |
193 |
28 |
209 |
|
Wakefield |
2,681 |
193 |
129 |
54 |
|
Wokingham |
3,010 |
192 |
49 |
106 |
|
East Devon |
1,567 |
191 |
50 |
124 |
|
Cardiff |
2,662 |
190 |
66 |
51 |
|
Leicester |
3,129 |
189 |
55 |
51 |
|
East Riding of Yorkshire |
3,033 |
189 |
28 |
55 |
|
Rhondda Cynon Taf |
1,238 |
189 |
13 |
79 |
|
Belfast |
4,992 |
188 |
41 |
54 |
|
Stratford-on-Avon |
2,356 |
183 |
62 |
132 |
|
Bexley |
2,010 |
183 |
34 |
74 |
|
Oxford |
1,522 |
181 |
42 |
111 |
|
Carmarthenshire |
1,411 |
180 |
72 |
95 |
|
Dudley |
2,148 |
179 |
69 |
55 |
|
Swindon |
43,562 |
178 |
44 |
76 |
|
Derby |
2,985 |
176 |
79 |
67 |
|
Salford |
1,580 |
172 |
35 |
62 |
|
Newport |
1,370 |
170 |
50 |
105 |
|
Winchester |
2,252 |
169 |
37 |
130 |
|
Mid Sussex |
2,166 |
168 |
41 |
108 |
|
Redbridge |
2,692 |
167 |
32 |
54 |
|
Vale of Glamorgan |
1,305 |
165 |
17 |
124 |
|
Gwynedd |
657 |
164 |
19 |
140 |
|
Renfrewshire |
9,900 |
156 |
44 |
85 |
|
Windsor and Maidenhead |
53,580 |
155 |
9 |
100 |
|
Bromley |
3,895 |
153 |
52 |
46 |
|
East Suffolk |
2,235 |
153 |
42 |
62 |
|
Doncaster |
3,803 |
146 |
38 |
47 |
|
York |
1,884 |
146 |
36 |
71 |
|
Folkestone and Hythe |
863 |
146 |
20 |
132 |
|
Bristol, City of |
3,915 |
143 |
54 |
30 |
|
Powys |
968 |
143 |
23 |
107 |
|
Argyll and Bute |
689 |
143 |
28 |
163 |
|
Vale of White Horse |
2,242 |
141 |
17 |
99 |
|
Cotswold |
1,334 |
140 |
9 |
153 |
|
Lancaster |
1,107 |
139 |
26 |
96 |
|
Lincoln |
561 |
139 |
35 |
136 |
|
Portsmouth |
10,461 |
137 |
13 |
66 |
|
Mole Valley |
2,146 |
136 |
20 |
155 |
|
Rotherham |
1,932 |
134 |
58 |
50 |
|
East Ayrshire |
989 |
134 |
27 |
111 |
|
Peterborough |
27,988 |
132 |
43 |
61 |
|
Kirklees |
3,146 |
132 |
57 |
30 |
|
Wigan |
2,197 |
132 |
56 |
40 |
|
Crawley |
926 |
131 |
44 |
110 |
|
Ceredigion |
542 |
131 |
30 |
183 |
|
Lewes |
1,051 |
130 |
10 |
129 |
|
Warwick |
1,996 |
125 |
19 |
83 |
|
Ipswich |
1,018 |
125 |
30 |
90 |
|
Guildford |
2,422 |
124 |
32 |
85 |
|
Kingston upon Hull, City of |
1,134 |
124 |
31 |
46 |
|
South Cambridgeshire |
3,082 |
123 |
17 |
74 |
|
Bridgend |
1,859 |
122 |
28 |
84 |
|
Falkirk |
1,519 |
122 |
25 |
77 |
|
Rugby |
1,299 |
122 |
68 |
105 |
|
Conwy |
864 |
122 |
5 |
107 |
|
North Somerset |
2,944 |
121 |
44 |
55 |
|
Basingstoke and Deane |
2,278 |
119 |
21 |
63 |
|
Southampton |
1,411 |
119 |
18 |
47 |
|
Stafford |
1,535 |
118 |
70 |
85 |
|
Monmouthshire |
1,056 |
117 |
18 |
125 |
|
North Devon |
806 |
117 |
20 |
116 |
|
Huntingdonshire |
2,681 |
115 |
65 |
63 |
|
Hart |
1,816 |
115 |
33 |
114 |
|
Stoke-on-Trent |
1,738 |
115 |
37 |
44 |
|
Wealden |
2,154 |
113 |
12 |
69 |
|
New Forest |
2,092 |
113 |
19 |
64 |
|
Woking |
1,309 |
113 |
2 |
109 |
|
North Ayrshire |
988 |
113 |
30 |
85 |
|
Worthing |
845 |
113 |
11 |
101 |
|
Bath and North East Somerset |
2,361 |
111 |
21 |
57 |
|
West Oxfordshire |
1,528 |
111 |
10 |
95 |
|
Stockton-on-Tees |
1,507 |
111 |
36 |
56 |
|
Norwich |
874 |
109 |
31 |
75 |
|
East Hertfordshire |
2,103 |
106 |
15 |
70 |
|
Bracknell Forest |
1,680 |
106 |
7 |
84 |
|
Wirral |
2,503 |
105 |
15 |
33 |
|
Teignbridge |
1,451 |
105 |
48 |
77 |
|
South Kesteven |
1,397 |
105 |
58 |
73 |
|
Herefordshire, County of |
1,912 |
104 |
22 |
55 |
|
Oldham |
1,383 |
104 |
61 |
43 |
|
Darlington |
2,380 |
103 |
8 |
94 |
|
Colchester |
1,742 |
102 |
48 |
53 |
|
Braintree |
1,390 |
102 |
22 |
65 |
|
Dover |
837 |
101 |
27 |
86 |
|
Stockport |
89,220 |
100 |
73 |
34 |
|
Elmbridge |
3,261 |
100 |
37 |
71 |
|
Barnsley |
1,817 |
100 |
22 |
41 |
|
Bromsgrove |
1,398 |
100 |
76 |
100 |
|
Bassetlaw |
1,112 |
100 |
70 |
83 |
|
West Lothian |
1,967 |
99 |
39 |
55 |
|
Arun |
1,370 |
99 |
17 |
60 |
|
North Norfolk |
916 |
99 |
6 |
96 |
|
Babergh |
952 |
98 |
33 |
104 |
|
Blaby |
1,243 |
97 |
34 |
93 |
|
Midlothian |
1,095 |
96 |
21 |
99 |
|
South Ayrshire |
1,042 |
96 |
19 |
86 |
|
West Lancashire |
1,307 |
95 |
25 |
80 |
|
Angus |
1,044 |
95 |
38 |
83 |
|
Forest of Dean |
912 |
95 |
15 |
108 |
|
Sandwell |
4,258 |
94 |
52 |
27 |
|
Waverley |
2,207 |
94 |
15 |
72 |
|
Dartford |
1,284 |
94 |
42 |
79 |
|
Denbighshire |
840 |
94 |
40 |
97 |
|
Breckland |
1,242 |
93 |
29 |
65 |
|
Isle of Wight |
1,201 |
93 |
13 |
66 |
|
Rushcliffe |
1,865 |
92 |
60 |
76 |
|
Eastleigh |
1,726 |
92 |
8 |
66 |
|
Calderdale |
1,490 |
92 |
50 |
44 |
|
Canterbury |
1,456 |
92 |
25 |
58 |
|
South Hams |
1,172 |
92 |
5 |
102 |
|
Scottish Borders |
1,050 |
92 |
29 |
79 |
|
Slough |
32,704 |
91 |
47 |
57 |
|
Harborough |
2,307 |
91 |
13 |
91 |
|
Flintshire |
1,137 |
91 |
46 |
59 |
|
Isle of Anglesey |
475 |
91 |
10 |
132 |
|
Wyre |
1,041 |
90 |
30 |
78 |
|
Runnymede |
1,201 |
89 |
16 |
101 |
|
South Ribble |
1,139 |
89 |
28 |
79 |
|
Blaenau Gwent |
260 |
89 |
5 |
133 |
|
Stevenage |
579 |
88 |
6 |
98 |
|
South Oxfordshire |
2,516 |
87 |
26 |
57 |
|
Horsham |
2,149 |
87 |
14 |
59 |
|
Test Valley |
1,848 |
87 |
32 |
66 |
|
Thurrock |
1,358 |
87 |
67 |
49 |
|
Newark and Sherwood |
1,352 |
87 |
45 |
70 |
|
Hinckley and Bosworth |
1,169 |
87 |
17 |
76 |
|
East Lindsey |
1,005 |
87 |
13 |
60 |
|
Broadland |
1,457 |
86 |
44 |
64 |
|
Luton |
1,061 |
86 |
33 |
38 |
|
Barking and Dagenham |
1,488 |
85 |
19 |
39 |
|
East Staffordshire |
1,101 |
85 |
37 |
68 |
|
South Norfolk |
1,699 |
84 |
13 |
58 |
|
Wychavon |
1,725 |
83 |
26 |
62 |
|
Chichester |
1,649 |
83 |
13 |
66 |
|
Wolverhampton |
1,442 |
83 |
50 |
31 |
|
Ashford |
1,426 |
83 |
8 |
61 |
|
City of London |
480 |
83 |
7 |
765 |
|
Charnwood |
1,981 |
82 |
35 |
44 |
|
West Dunbartonshire |
589 |
82 |
38 |
93 |
|
Chesterfield |
7,074 |
81 |
25 |
78 |
|
Havering |
2,283 |
81 |
50 |
31 |
|
Cheltenham |
1,228 |
81 |
13 |
68 |
|
Mid Suffolk |
1,575 |
80 |
8 |
76 |
|
Rochdale |
1,413 |
80 |
41 |
35 |
|
South Staffordshire |
1,099 |
80 |
50 |
72 |
|
Gloucester |
1,056 |
80 |
13 |
60 |
|
Caerphilly |
1,001 |
80 |
10 |
45 |
|
Inverclyde |
593 |
80 |
30 |
102 |
|
Chorley |
1,358 |
79 |
60 |
67 |
|
Preston |
1,190 |
79 |
32 |
52 |
|
Telford and Wrekin |
1,682 |
78 |
42 |
41 |
|
Epping Forest |
1,855 |
77 |
33 |
57 |
|
Moray |
716 |
76 |
15 |
81 |
|
Great Yarmouth |
530 |
76 |
16 |
76 |
|
Maidstone |
1,857 |
75 |
34 |
42 |
|
Gedling |
1,088 |
75 |
16 |
64 |
|
Tonbridge and Malling |
1,796 |
74 |
19 |
55 |
|
Worcester |
833 |
74 |
33 |
71 |
|
Bolton |
2,011 |
73 |
28 |
24 |
|
Walsall |
1,476 |
73 |
27 |
26 |
|
Basildon |
2,105 |
72 |
18 |
38 |
|
Hertsmere |
1,913 |
72 |
40 |
67 |
|
North Tyneside |
1,662 |
72 |
26 |
34 |
|
Bolsover |
692 |
72 |
18 |
88 |
|
St Albans |
2,575 |
71 |
15 |
48 |
|
Swale |
1,113 |
71 |
17 |
46 |
|
Surrey Heath |
1,886 |
70 |
14 |
77 |
|
North Lincolnshire |
1,252 |
68 |
23 |
40 |
|
Eastbourne |
685 |
68 |
16 |
67 |
|
Derbyshire Dales |
837 |
67 |
12 |
93 |
|
Torfaen |
642 |
67 |
5 |
72 |
|
Harrow |
3,311 |
63 |
19 |
24 |
|
Newcastle-under-Lyme |
984 |
62 |
31 |
50 |
|
Gravesham |
959 |
62 |
7 |
58 |
|
Fermanagh and Omagh |
391 |
61 |
10 |
52 |
|
Sevenoaks |
1,884 |
60 |
20 |
50 |
|
Dacorum |
2,156 |
59 |
31 |
38 |
|
Chelmsford |
2,131 |
59 |
22 |
32 |
|
Bury |
1,857 |
59 |
34 |
30 |
|
Spelthorne |
1,055 |
59 |
11 |
57 |
|
Redcar and Cleveland |
788 |
59 |
14 |
43 |
|
Burnley |
479 |
59 |
18 |
62 |
|
Tewkesbury |
1,269 |
58 |
20 |
60 |
|
Broxtowe |
947 |
58 |
27 |
52 |
|
Causeway Coast and Glens |
668 |
57 |
15 |
40 |
|
Halton |
2,171 |
56 |
9 |
43 |
|
North Hertfordshire |
1,850 |
56 |
21 |
42 |
|
South Derbyshire |
1,150 |
56 |
8 |
50 |
|
North Warwickshire |
589 |
56 |
22 |
85 |
|
Uttlesford |
1,702 |
55 |
29 |
59 |
|
Amber Valley |
1,269 |
55 |
18 |
43 |
|
Adur |
679 |
55 |
9 |
85 |
|
Sefton |
1,842 |
54 |
25 |
19 |
|
North West Leicestershire |
1,264 |
54 |
17 |
50 |
|
Broxbourne |
886 |
54 |
4 |
55 |
|
West Devon |
538 |
54 |
19 |
93 |
|
Orkney Islands |
456 |
54 |
11 |
245 |
|
Na h-Eileanan Siar |
146 |
54 |
12 |
207 |
|
Three Rivers |
1,632 |
53 |
5 |
56 |
|
Thanet |
919 |
53 |
22 |
38 |
|
East Cambridgeshire |
1,107 |
52 |
9 |
58 |
|
High Peak |
823 |
52 |
17 |
57 |
|
Middlesbrough |
615 |
52 |
23 |
35 |
|
Tameside |
1,245 |
50 |
26 |
22 |
|
Torridge |
538 |
50 |
7 |
73 |
|
Clackmannanshire |
441 |
50 |
9 |
97 |
|
East Hampshire |
1,919 |
49 |
21 |
39 |
|
Antrim and Newtownabbey |
1,902 |
49 |
14 |
34 |
|
Armagh City, Banbridge and Craigavon |
1,215 |
49 |
10 |
22 |
|
Blackburn with Darwen |
966 |
49 |
20 |
32 |
|
Mansfield |
802 |
49 |
25 |
44 |
|
Ribble Valley |
749 |
49 |
1 |
78 |
|
Rushmoor |
4,688 |
48 |
20 |
48 |
|
Havant |
1,222 |
47 |
21 |
38 |
|
North East Lincolnshire |
941 |
47 |
16 |
30 |
|
Newry, Mourne and Down |
917 |
47 |
14 |
26 |
|
Mid Devon |
736 |
46 |
19 |
55 |
|
Cannock Chase |
970 |
45 |
26 |
45 |
|
Ashfield |
932 |
45 |
11 |
35 |
|
Wrexham |
789 |
45 |
13 |
33 |
|
Blackpool |
757 |
45 |
3 |
32 |
|
Reigate and Banstead |
2,499 |
44 |
10 |
29 |
|
Tunbridge Wells |
1,453 |
44 |
16 |
38 |
|
Wyre Forest |
768 |
43 |
24 |
42 |
|
Tendring |
1,102 |
42 |
15 |
28 |
|
Torbay |
895 |
42 |
14 |
30 |
|
Fylde |
868 |
42 |
21 |
51 |
|
South Holland |
802 |
42 |
10 |
43 |
|
Rossendale |
552 |
42 |
25 |
59 |
|
Oadby and Wigston |
488 |
42 |
7 |
72 |
|
South Tyneside |
961 |
41 |
7 |
28 |
|
West Lindsey |
950 |
41 |
23 |
42 |
|
Merthyr Tydfil |
261 |
41 |
5 |
70 |
|
East Renfrewshire |
1,385 |
40 |
22 |
41 |
|
Tandridge |
1,314 |
40 |
13 |
45 |
|
Lisburn and Castlereagh |
1,727 |
39 |
8 |
26 |
|
Harlow |
943 |
39 |
7 |
41 |
|
Shetland Islands |
177 |
39 |
6 |
169 |
|
Lichfield |
1,430 |
38 |
14 |
35 |
|
St. Helens |
1,279 |
38 |
23 |
21 |
|
Hartlepool |
496 |
38 |
8 |
41 |
|
North Kesteven |
1,256 |
37 |
16 |
31 |
|
Southend-on-Sea |
1,140 |
37 |
14 |
21 |
|
Brentwood |
950 |
37 |
21 |
48 |
|
Knowsley |
938 |
37 |
16 |
24 |
|
Boston |
414 |
37 |
13 |
52 |
|
East Dunbartonshire |
1,385 |
36 |
8 |
33 |
|
Malvern Hills |
993 |
36 |
8 |
44 |
|
Erewash |
913 |
36 |
18 |
32 |
|
Derry City and Strabane |
631 |
36 |
6 |
24 |
|
Neath Port Talbot |
814 |
35 |
14 |
25 |
|
Rochford |
832 |
34 |
15 |
39 |
|
Hyndburn |
530 |
34 |
9 |
41 |
|
Mid Ulster |
639 |
33 |
8 |
22 |
|
Rutland |
495 |
33 |
7 |
80 |
|
Hastings |
477 |
33 |
12 |
36 |
|
Gosport |
451 |
33 |
8 |
40 |
|
Fareham |
1,381 |
31 |
15 |
27 |
|
Nuneaton and Bedworth |
965 |
31 |
13 |
23 |
|
Mid and East Antrim |
816 |
30 |
10 |
22 |
|
Ards and North Down |
1,376 |
29 |
15 |
18 |
|
Rother |
933 |
29 |
15 |
31 |
|
Maldon |
707 |
28 |
8 |
41 |
|
Redditch |
2,116 |
25 |
7 |
29 |
|
Epsom and Ewell |
1,125 |
25 |
7 |
31 |
|
Staffordshire Moorlands |
751 |
25 |
5 |
26 |
|
North East Derbyshire |
953 |
22 |
3 |
21 |
|
Tamworth |
625 |
22 |
11 |
28 |
|
Pendle |
487 |
20 |
5 |
21 |
|
Fenland |
701 |
14 |
3 |
14 |
|
Melton |
567 |
12 |
2 |
23 |
|
Castle Point |
597 |
3 |
3 |
3 |
|
Isles of Scilly |
45 |
0 |
0 |
0 |
EV-Friendly Routes to Tourist Destinations
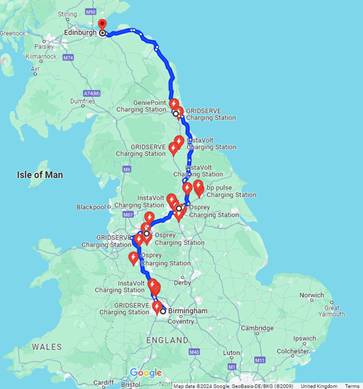
Planning a road trip with an electric vehicle involves considering the availability of charging stations along your route. We’ve plotted some recommended routes that offer optimal access to EV chargers, ensuring you can explore some of the UK's best tourist destinations in your Electric Vehicle with peace of mind.
Note: The average range of an EV between charges is 80-250 miles. These routes are the safest to ensure you never get caught short when travelling long distances due to the availability and frequency of chargers.
Source: Zapmap
Birmingham to Edinburgh
Start in Birmingham
- Birmingham to Manchester (approx. 85 miles)
- Take the M6 and M56 motorways.
- Charging stop in Manchester: Robust charging infrastructure in the city.
- Manchester to Leeds (approx. 45 miles)
- Take the M62 highway.
- Charging stop in Leeds: Good availability of chargers in the city.
- Leeds to Newcastle upon Tyne (approx. 95 miles)
- Take the A1(M) highway.
- Charging stop in Newcastle: Numerous chargers are available, including fast chargers.
- Newcastle to Edinburgh (approx. 120 miles)
-
- Take the A1 highway.
- Charging stop in Edinburgh: Ensure enough charge to reach the destination.
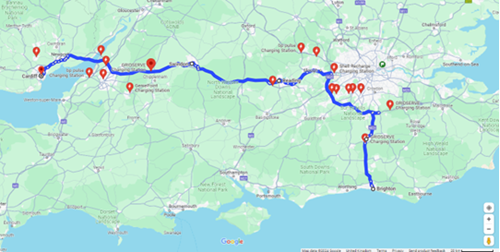
Brighton & Hove to Cardiff
Start in Brighton & Hove
- Brighton & Hove to Crawley (approx. 22 miles)
- Take the A23 highway.
- Charging stop in Crawley: Known for good charging infrastructure due to proximity to Gatwick Airport.
- Crawley to Reading (approx. 60 miles)
- Take the M23 and M25 highways, then the M4.
- Charging stop in Reading: Significant charging infrastructure available in the city.
- Reading to Swindon (approx. 45 miles)
- Take the M4 highway.
- Charging stop in Swindon: Notable charging facilities.
- Swindon to Cardiff (approx. 75 miles)
-
- Take the M4 highway.
- Charging stop in Cardiff: Well-established charging infrastructure in the city.
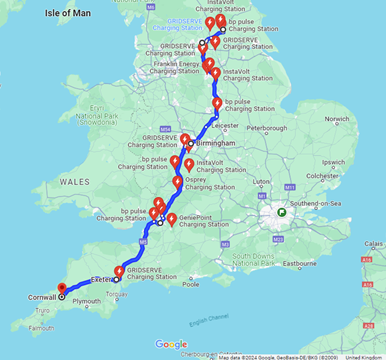
York to Cornwall
Start in York
- York to Leeds (approx. 25 miles)
- Take the A64 highway.
- Charging stop in Leeds: Significant charging infrastructure available in the city.
- Leeds to Birmingham (approx. 120 miles)
- Take the M1 and M42 highways.
- Charging stop in Birmingham: Extensive charging network in the city.
- Birmingham to Bristol (approx. 85 miles)
- Take the M5 highway.
- Charging stop in Bristol: Notable charging facilities available.
- Bristol to Exeter (approx. 75 miles)
- Continue on the M5 highway.
- Charging stop in Exeter: Substantial charging infrastructure.
- Exeter to Cornwall (approx. 75 miles)
- Take the A30 highway.
- Charging stop in Cornwall: Ensure sufficient charge to reach the destination.
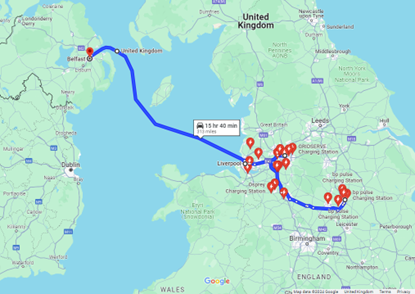
Nottingham to Belfast
Start in Nottingham
- Nottingham to Manchester (approx. 70 miles)
- Take the A52 and M60 highways.
- Charging stop in Manchester: Extensive charging network in the city.
- Manchester to Liverpool (approx. 35 miles)
- Take the M62 highway.
- Charging stop in Liverpool: Good charging facilities are available.
- Liverpool to Belfast (via Ferry)
- Take the ferry from Liverpool to Belfast.
- Charging stop in Belfast: Well-established charging infrastructure in the city.
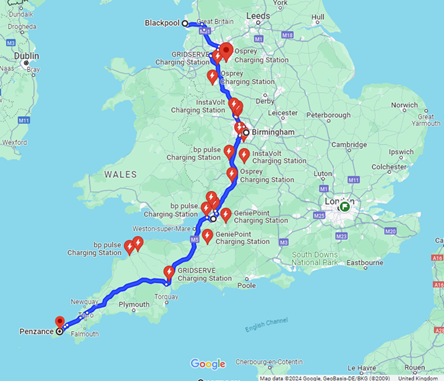
Blackpool to The Isles of Scilly
Start in Blackpool
- Blackpool to Birmingham (approx. 125 miles)
- Take the M6 highway.
- Charging stop in Birmingham: Extensive charging network in the city.
- Birmingham to Bristol (approx. 85 miles)
- Take the M5 highway.
- Charging stop in Bristol: Notable charging facilities available.
- Bristol to Penzance (approx. 160 miles)
- Take the M5 and A30 highways.
- Charging stop in Penzance: Ensure sufficient charge before ferry departure.
- Penzance to the Isles of Scilly (via Ferry)
- Take the ferry from Penzance to the Isles of Scilly.
- Final destination: Zero public charging options on the Isles of Scilly, so ensure full charge before departure.
Data Sources
- Gov.UK: Vehicle licensing statistics: January to March 2024
- Gov.UK: Vehicle licensing statistics data tables - Attachment “Veh0132” & “Veh1103”
- Gov.UK: Electric vehicle charging devices by local authority (July 2024)
- Google Maps data August 2024
Find out more with our Drive to Zero Hub
Drive to Zero